


Nowadays we use our smartphones wherever we go. Every minute we use them, they collect data.
With Trace.me, I collected my own usage data, and visualized it within three interactive layers:
My location history accessed via the Google Takeout service. It’s displayed per day.
Jery allows to setup surgeries digitally. Changes get broadcasted to all team members automatically.
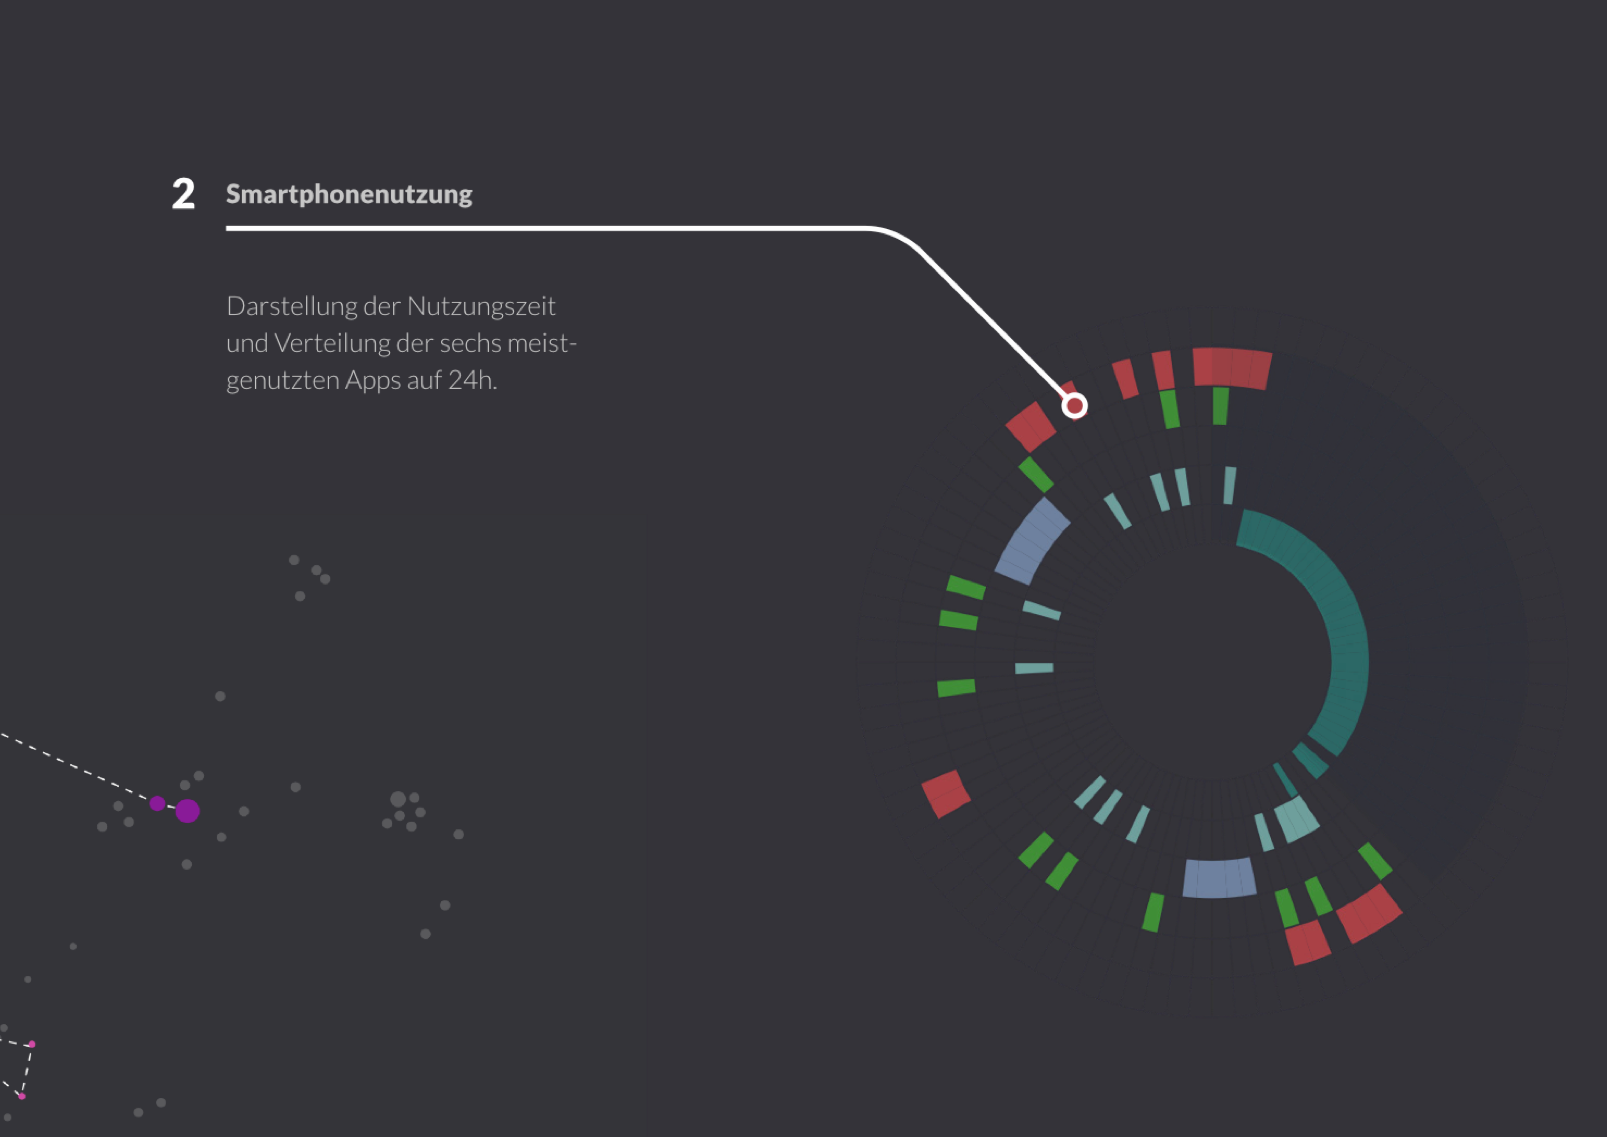
The 6 most used apps and the smartphone activity over the course of 24h.
Matthea can set up digital reports via the chat function. She gets notified when the problem is fixed.
The total time I spent in the respective apps and on my smartphone within two weeks.
Jery allows to setup surgeries digitally. Changes get broadcasted to all team members automatically.
A digital assistant that supports the user on an emotional level and guides him through the app. Klara also shows relevant infos.
Matthea can set up digital reports via the chat function. She gets notified when the problem is fixed.
First I researched different datasets and thought of ways how to visualize and navigate through them.


Then I collected my smartphone data and developed a function in JavaScript processing the data.


In the last step I developed a colour scheme and layout and coded it using paper.js


